|
|
 |
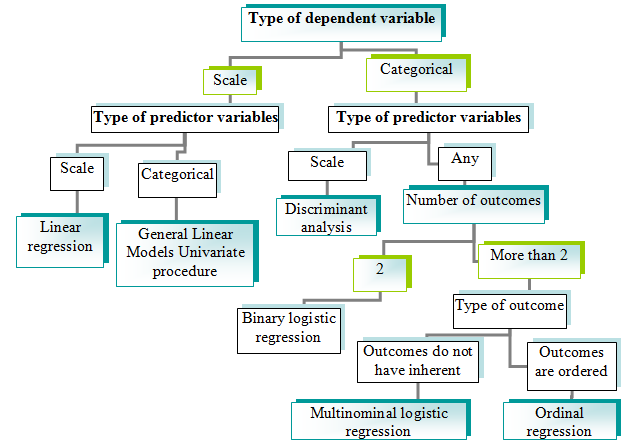
We used correlation analysis in order to reveal association between two variables. With correlation analysis we can understand presence of association and its strength; however, we cannot study functional dependence between variables. Functional dependency is studied in regression analysis. In correlation two variables are treated as equal, however in regression one (or several) variables are considered independent (predictor) and another variable – dependent (outcome).
Regression analysis is one of the methods of prognosis: by values of already measured predictors we may predict value of an outcome variable:

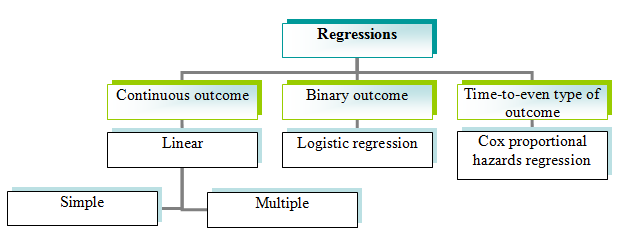
Linear regressions are used for continuous outcome; among these regressions simple (or univariate) is used to study relation between one dependent and one predictor variables and multiple (multivariate) regression is used to study relation between one dependent and multiple predictor variables:

For binary outcomes logistic regression is used. This is very common type of outcome, it can indicate presence or absence of some parameter (virulent/non-virulent strain, sensitive/resistant, etc.); it may also indicate result of some process (e.g., result of treatment – favourable/unfavourable outcome of disease). Because of this, logistic regression also has become popular method in recent times. Logistic regression actually is used not only for describing relationship between variables but first of all for prognosis of values of dependent variable, particularly to assess probability of dependent variable to fall into some class (e.g., strain is more likely to be virulent or non-virulent, outcome of disease in individual patient is more likely to be favourable or not, etc.), because of this logistic regression will be discussed in the chapter with prognosis methods.
When outcome belongs to time-to-event type (survival data) cox proportional hazards regression is used. This regression is the most popular in medicine, where it assesses survival of patients during particular time.
Regression analysis nowadays is commonly used in different microbiological studies. The table below shows some selected examples on application of different types of regression in microbiology.
Selected examples on application of regression analysis in microbiological studies
|
Dependent variable
|
Predictor variables
|
Method of regression
|
Reference
|
|
Molecular cluster of Mycobacterium tuberculosis in Switzerland
|
Cavitary disease, sex, and age
|
Logistic regression
|
Fenner et al., 2012
|
|
Attributable mortality in patients with complicated bacteremia caused by methicillin-resistant Staphylococcus aureus
|
Acute Physiology and Chronica health Evaluation Score-II (APACHE-II), vancomycin area under the concentration-time curve (AUC)/MIC ratio
|
Classification and regression tree analysis (CART), logistic regression
|
Brown et al., 2012
|
|
Mortality in patients with Pseudomonas aeruginosa bacteremia
|
Carbapenem resistance
|
Cox regression
|
Peña et al., 2012
|
|
Outcome in patients with Clostridium difficile infection
|
Sex, age, severity of comorbidity
|
Poisson regression
|
Wenisch et al., 2012
|
|
Diagnostic performance in diagnosis of Toxoplasma gondii infection
|
Peptides mimicking epitopes from T. gondii antigens
|
Logistic regression
|
Maksimov et al., 2012
|
|
Presence of complications in patients with pulmonary hydatidosis
|
Seropositivity
|
Logistic regression
|
Santivañez et al., 2012
|
|
Hepatitis A virus inactivation rates in contaminated green onions
|
Storage temperature
|
Linear regression
|
Sun et al., 2012
|
|
Outcomes in patients with bloodstream infections caused by extended-spectrum beta lactamase-producing pathogens
|
Intensive care unit stay, presence of a central line prior to positive culture, presence of a rapidly fatal condition at the time of admission, recent prior hospitalization, empiric carbapenem therapy, receipt of empiric cefepime, etc.
|
Logistic regression
|
Chopra et al., 2012
|
|
Nucleoside reverse transcriptase inhibitor susceptibility
|
HIV-1 reverse transcriptase mutations
|
Least-squares regression
|
Melikian et al., 2012
|
|
Nephrotoxicity associated with colistin use
|
Body mass index, diabetes, the length of hospitalization in days prior to receipt of colistin, age, etc.
|
Logistic regression
|
Gauthier et al., 2012
|
|
MIC distribution analysis for posaconazole, itraconazole, and voriconazole for A. fumigatus isolates
|
Mutations in the cyp51A gene
|
Nonlinear regression
|
Meletiadis et al., 2012
|
|
Outcomes in patients with bacteremia due to vancomycin-resistant Enterococcus
|
Bacteremia due to vancomycin-resistant E. faecalis and E. faecium
|
Logistic regression
|
Hayakawa et al., 2012
|
|
28-day mortality and clinical response in patients with methicillin-resistant Staphylococcus aureus pneumonia
|
Age, APACHE II score, AIDS, cardiac disease, vascular disease, diabetes, SCCmec type II, Panton-Valentine leukocidin negativity, higher vancomycin MIC, etc.
|
Multivariate regression
|
Haque et al., 2012
|
|
The risk of in vitro resistance to pyrimethamine in Plasmodium falciparum
|
Mutations F423Y in the pfmdr2 gene, N51I, C59R, and S108N in the pfdhfr gene
|
Logistic regression
|
Briolant et al., 2012
|
|
Antibiotic effect
|
Antibiotic concentration
|
Sigmoidal regressions, biphasic regressions
|
Garcia et al., 2012
|
|
Acquisition of multidrug-resistant Proteus mirabilis isolates responsible for bloodstream infections; impact on mortality of such infections
|
Admission from a long-term care facility, previous therapy with fluoroquinolones or oxyimino-cephalosporins, urinary catheterization, previous hospitalization, etc.
|
Multivariate regression analysis
|
Tumbarello et al., 2012
|
|
Concentrations of protozoa and indicator bacteria (Escherichia coli and total coliform)
|
Wetland type, seasonality, rainfall, and various water quality parameters
|
Longitudinal Poisson regression
|
Hogan et al., 2012
|
|
Outcome in patients with HIV-associated tuberculous meningitis
|
Mycobacterium tuberculosis drug resistance, bacterial lineage, and host vaccination status
|
Cox multiple regression models
|
Tho et al., 2012
|
|
Area under the concentration-time curve from 0 to 12 h (AUC0-12) of antituberculosis drugs
|
Age, sex, weight, drug dose/kilogram, CD4+ lymphocyte count, treatment schedule, and concurrent antiretrovirals
|
Multilevel linear mixed-effects regression
|
McIlleron et al., 2012
|
|
|
|
|
|
|
 |
|