Many statistical software have special options for the analysis of tables of categorical data. To discuss opportunities given by SPSS in the analysis of tables we will add one more column with values of categorical variable to our second data example (Example 2) – “Type of interactions”. This column will describe the type of interactions between tea tree oil and gatifloxacin. We can insert a new variable by selecting a variable, before which it should be inserted and clicking the Insert Variable button in the Tool Bar.

After insertion a variable it is important to change the name of the variable (it will be “Interaction”) and also choose its type (String), width, scale and other properties.
We typed names of interactive effect which was defined as synergy if MIC of tea tree oil in the presence of gatifloxacin decreased at least by 4 times, indifference – if did not changed or decreased by 2 times, and antagonism – if MIC increased.
 We may answer the following research questions:
1) Against how many bacterial isolates effect was synergistic, indifferent and antagonistic?
2) Was the number of synergistic/indifferent/antagonistic effects different against two bacterial species?
To answer the first question we have to calculate
frequenciesof each effect:
1) Click the Analyze menu, then point to Descriptive Statistics, and select Frequencies…:
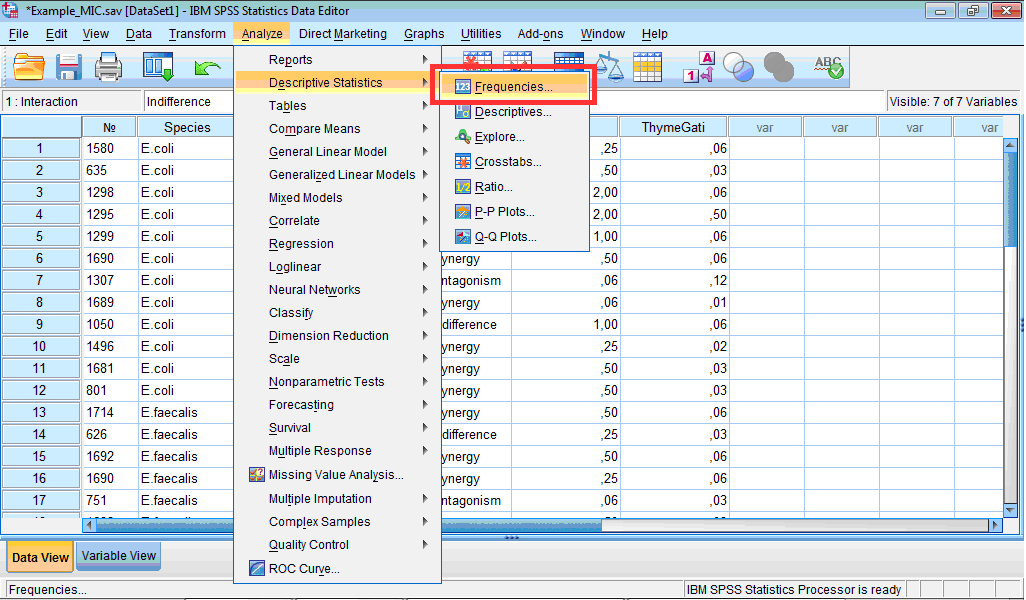
The Frequencies dialog box opens:
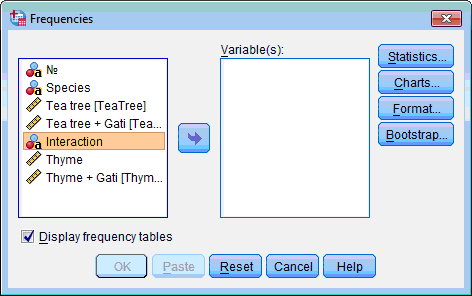
2) From the list box on the left select the variable for theanalysis(“Interaction”).
3) Click the transfer arrow button  . The selected variable is moved to the Variable(s): list box.
4) Select the Display frequency tables check box. If no additional statistics are necessary, other options may be left specified by default.
5) Click the OK button. An Output Viewer window opens and displays the results.
The resulting Interaction table has five columns; the first column lists values of the variables, the other display the absolute frequencies, and percents, overall, valid and cumulative, for each different type of interaction effect:

From this table we can notice that synergy was the commonest effect (in 62.5% of cases). However, this is not enough to say whether there are differences in the frequency of each effect between species.
To answer the question whether there were differences between frequencies of effects against two bacterial species,
E. coli and
E. faecalis, we have to use
Chi-square test:
1) Click the Analyze menu, point to Descriptive Statistics, and select Crosstabs…:
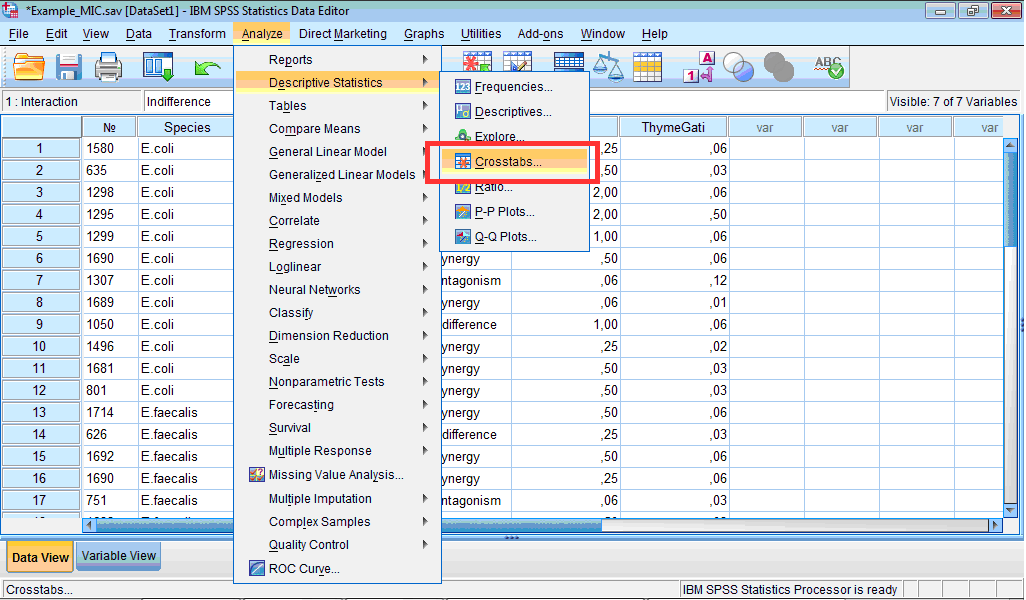
The Crosstabs dialog box opens:
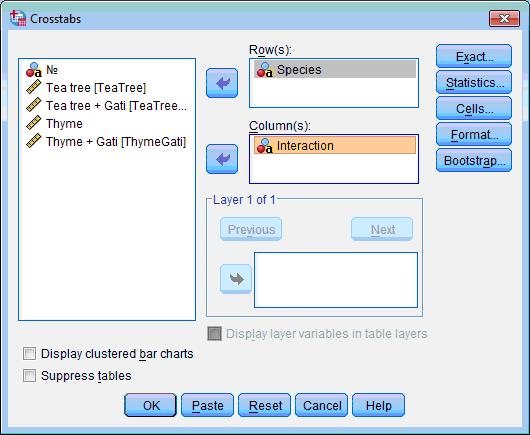
2) Select the variable which will be the row of future crosstab column (“Species”); click the upper transfer arrow button  . The selected variable is moved to the Row(s): list box.
3) Select the variable which will be the columns (“Interaction”), click the lower transfer arrow button  . The selected variable is moved to the Column(s): list box.
4) Click the Statistics… button. The Crosstabs: Statistics dialog box opens:
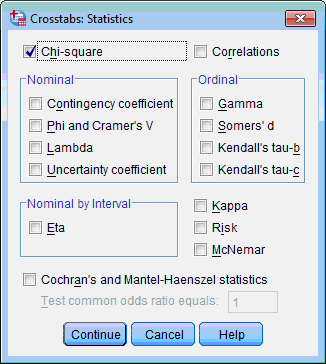
5) Select the Chi-square check box.
6) Click the Continue button. This returns you to the Crosstabs dialog box.
7) Usually it is useful to calculate not only frequencies but there percents in the cross-tabulation. Click the Cells… button. The Crosstabs: Cell Display dialog box opens:
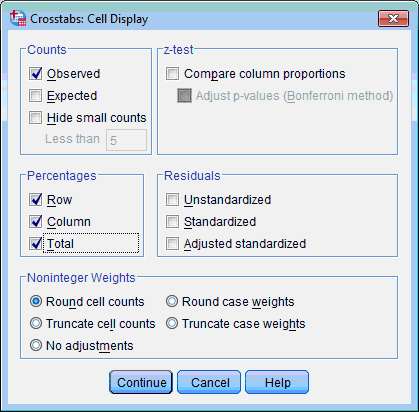
8) Select the Observed check box in the Counts section, Row, Column and Total check boxes in the Percentages section.
9) Again click the Continue button. This returns you to the Crosstabs dialog box.
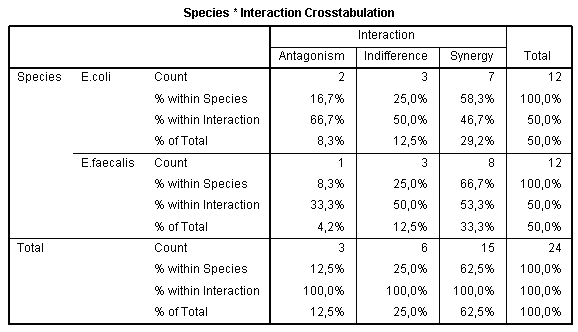
10) Click the OK button. An Output Viewer window opens and displays the crosstabulation results:
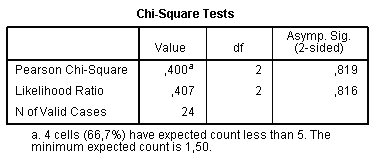
and statistics for the Chi-square test:
In the Output Viewer window we can see the frequencies of all types of effect depending on the species of bacterium. For example, synergistic effect was detected against 58.3% of all E. coli isolates and against 66.7% of E. faecalis isolates (% within species). Another conclusion – out of all obtained synergistic effects, 46.7% were against E. coli and other 53.3% – against E. faecalis (% within interaction). To understand, whether these differences are significant, we should look to the next table with results of the Chi-square test.
In the table Chi-square test the column Value shows the value of Chi-square, the column df shows degrees of freedom, which is calculated as (rows-1)×(columns-1). Because in our table there are two rows (for E. coli and for E. faecalis) and 3 columns (for antagonism, indifference and synergy), df = (2-1)×(3-1) = 2. The Asymp. Sig. column shows significance of differences (P-level). In general, with the same degrees of freedom, the larger Chi-square value, the more ‘significant’ it is.
Significance level is 0.819; therefore, differences between interaction effects towards two studied bacterial species are not significant. In other words, combination of tea tree oil with gatifloxacin has similar effect on E. coli and E. faecalis.
The Chi-square test itself does not give any information about the strength of relationship between variables, it only indicates its significance.

